
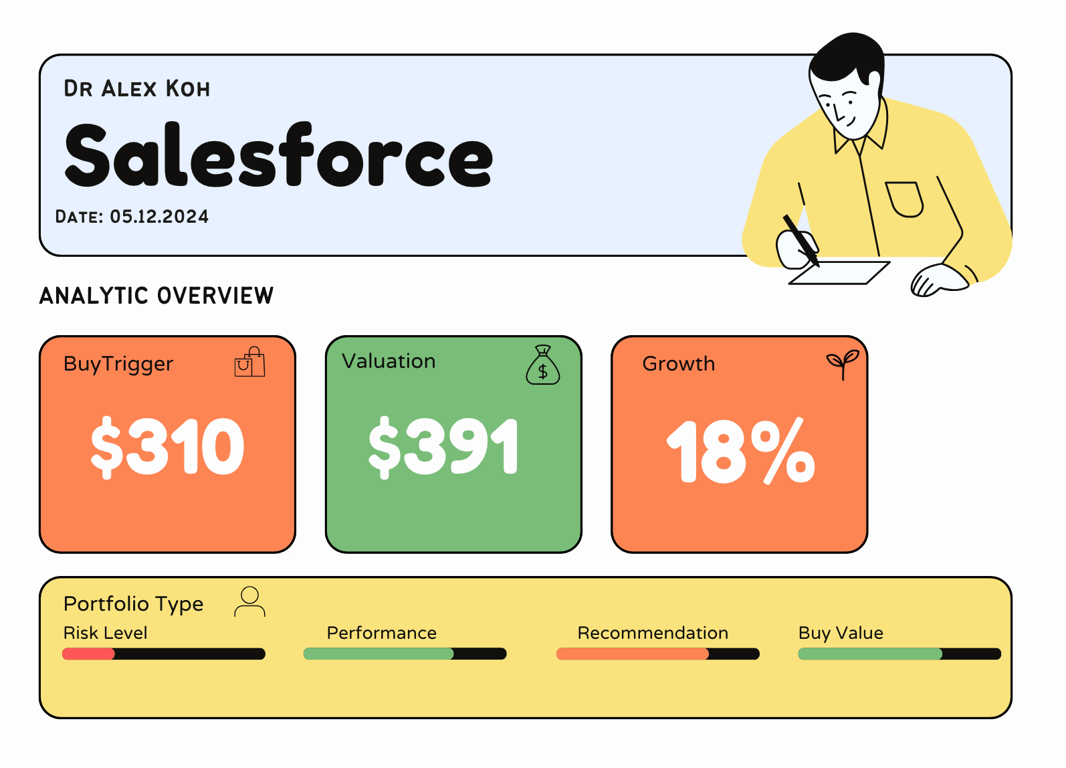

Salesforce Inc. (CRM) Stock Comprehensive Review as of December 6, 2024 🟢
Current Price: $361.38
Industry: Customer Relationship Management (CRM) Software
Stock Type: Growth
Rating: A
Key Financial Metrics (Q3 Fiscal 2024)
- Revenue: $8.72 billion, up 11% year-over-year.
- Net Income: $1.22 billion, a significant increase from $210 million YoY.
- Gross Margin: Approximately 75%, indicating strong operational efficiency.
- EPS (Earnings Per Share): $2.11 (non-GAAP), surpassing analyst expectations of $2.06.
- Free Cash Flow: $1.37 billion, reflecting robust cash generation.
💰 Valuation Analysis
- P/E Ratio: Approximately 45x, higher than the industry average, reflecting a growth premium.
- P/S Ratio: Approximately 10x, indicating that the market values its revenue growth highly.
- Forward P/E: Approximately 40x, suggesting a continued growth trajectory.
- PEG Ratio: Approximately 1.5, highlighting a good balance between growth and valuation.
- Market Cap: $361.38 billion, solidifying its status as a mega-cap stock.
📈 Growth Metrics
- 2025 EPS Growth Forecast: Salesforce is projected to see continued strong growth, driven by AI integration and expanding cloud services.
- Price Target: Analysts have set a consensus price target of $380, reflecting confidence in Salesforce’s sustained performance.
🔍 Revenue Breakdown
- Subscription and Support (93%): $8.14 billion (+13% YoY)
- Growth driven by increased adoption of cloud-based CRM solutions.
- Professional Services and Other (7%): $0.58 billion (-4% YoY)
- Slight decline due to strategic focus on high-margin subscription services.
🔮 Forecast
Salesforce continues to expand its footprint in the CRM software industry, with strong financials and market leadership. The company's growth is underpinned by significant investments in AI and cloud technologies, making it a cornerstone of future tech developments. While the stock trades at a premium, its robust earnings growth and market dominance justify the valuation.
Final Summary
- 🚀 Strong Buy: Salesforce’s leading position in the CRM market, combined with its exceptional financial performance, make it a top-tier stock.
- 📊 Strong Financials: With substantial revenue and net income growth, Salesforce’s financial health is outstanding.
- 💡 Valuation Justified: Despite high multiples, Salesforce’s growth potential in AI and cloud services supports its valuation.
- ⚠️ Minor Risks: Watch for short-term market fluctuations due to high valuations and potential regulatory changes, but the long-term outlook remains highly positive.
Salesforce remains one of the best-positioned tech stocks for growth in 2024 and beyond.
Interesting Facts
🕶️ Chronological Update below 👇🏻
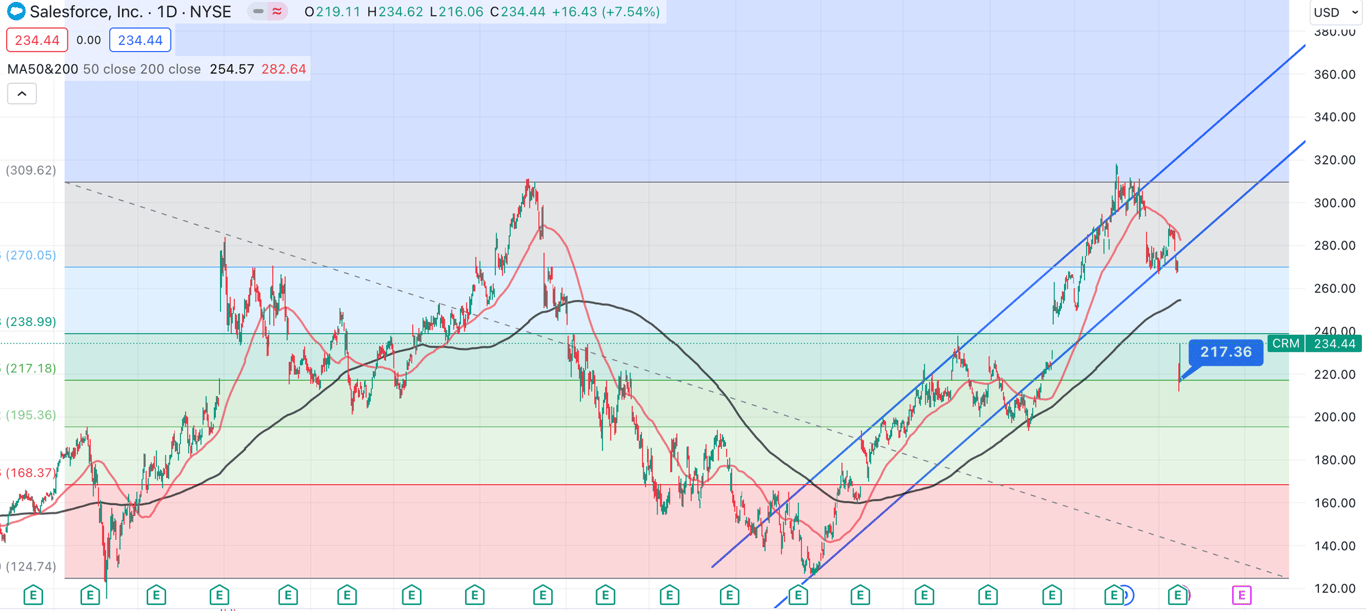
Technical Analysis Update [Jul 10, 2024 12:08 AM GMT+01:00]
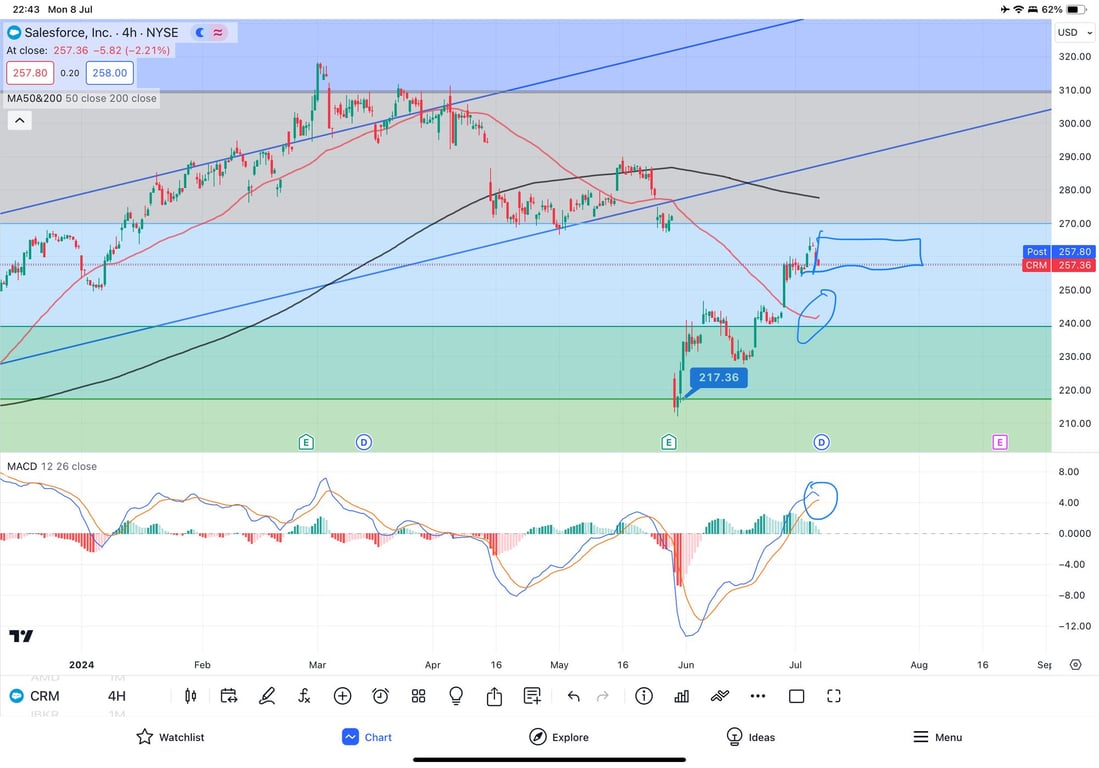
- Support and Resistance:
- Support: The recent low around $217.36 marked a significant support level where the price found a strong base and rebounded sharply.
- Resistance: The current resistance is in the $260-$265 range, as indicated by the blue box. This is an important level to watch for a breakout or a rejection.
- Moving Averages:
- 50-period moving average (red line): The price has recently crossed above this moving average, indicating a short-term bullish trend. This moving average is currently acting as a support level.
- 200-period moving average (black line): Positioned around $272, this represents a longer-term resistance. A break above this level would confirm a strong bullish trend.
- MACD (Moving Average Convergence Divergence):
- The MACD shows a bullish crossover with the MACD line above the signal line and the histogram in positive territory. This indicates that the bullish momentum is still strong.
- The recent MACD lines convergence hints at a potential short-term pullback or consolidation phase, but overall, the momentum remains positive.
- Price Action:
- The price has rebounded sharply from the $217.36 support level and is now testing the resistance around $260. This area is crucial for determining the next move.
- The price is currently trading within the blue shaded consolidation box between $245 and $260, suggesting a potential range-bound movement before a breakout.
- Trend Lines and Channels:
- The upward trend channel marked by the blue lines shows a long-term bullish trend. The price is currently below the upper boundary of this channel, indicating potential room for upside if the resistance is broken.
- The dotted downward trend line has been breached, suggesting a possible end to the previous downtrend and a shift towards a bullish phase.
- Potential Scenarios:
- Bullish Scenario: A breakout above $260-$265 with strong volume could push the price towards the next resistance at the 200-period moving average around $272, and potentially towards $280 and higher if the bullish momentum continues.
- Bearish Scenario: If the price fails to break above the current resistance, a pullback towards the $245 support level is possible. A break below this level could lead to a retest of the stronger support around $230-$235.
- Volume and Market Sentiment:
- Monitor the trading volume during this consolidation phase. Higher volume on a breakout will confirm the direction of the next move.
- Upcoming earnings (marked with "E") and dividend dates could also act as catalysts for significant price movements. Be prepared for increased volatility around these events.
In summary, Salesforce Inc. is at a critical resistance level around $260. The bullish MACD and recent price action suggest positive momentum, but the convergence of MACD lines indicates a potential short-term consolidation. Watch for a breakout or a pullback with volume confirmation to determine the next move.
Technical Analysis Update [Jun 1, 2024 10:44 PM GMT+01:00]
- Buy Trigger super safe at $217