

Shopify Inc. (SHOP) Stock Comprehensive Review as of November 23, 2024 🟢Current Price: $106.96Industry: E-commerce, SaaSStock Type: GrowthRating: B
💡 Key Financial Metrics (Q3 2024)
- Revenue: $2.16 billion, up 26% year-over-year.
- Net Income: $828 million, increasing from $718 million YoY.
- Gross Margin: 53%, indicating strong operational efficiency.
- EPS (Earnings Per Share): $0.64, surpassing analyst expectations of $0.19.
- Free Cash Flow: $421 million, reflecting robust cash generation.
💰 Valuation Analysis
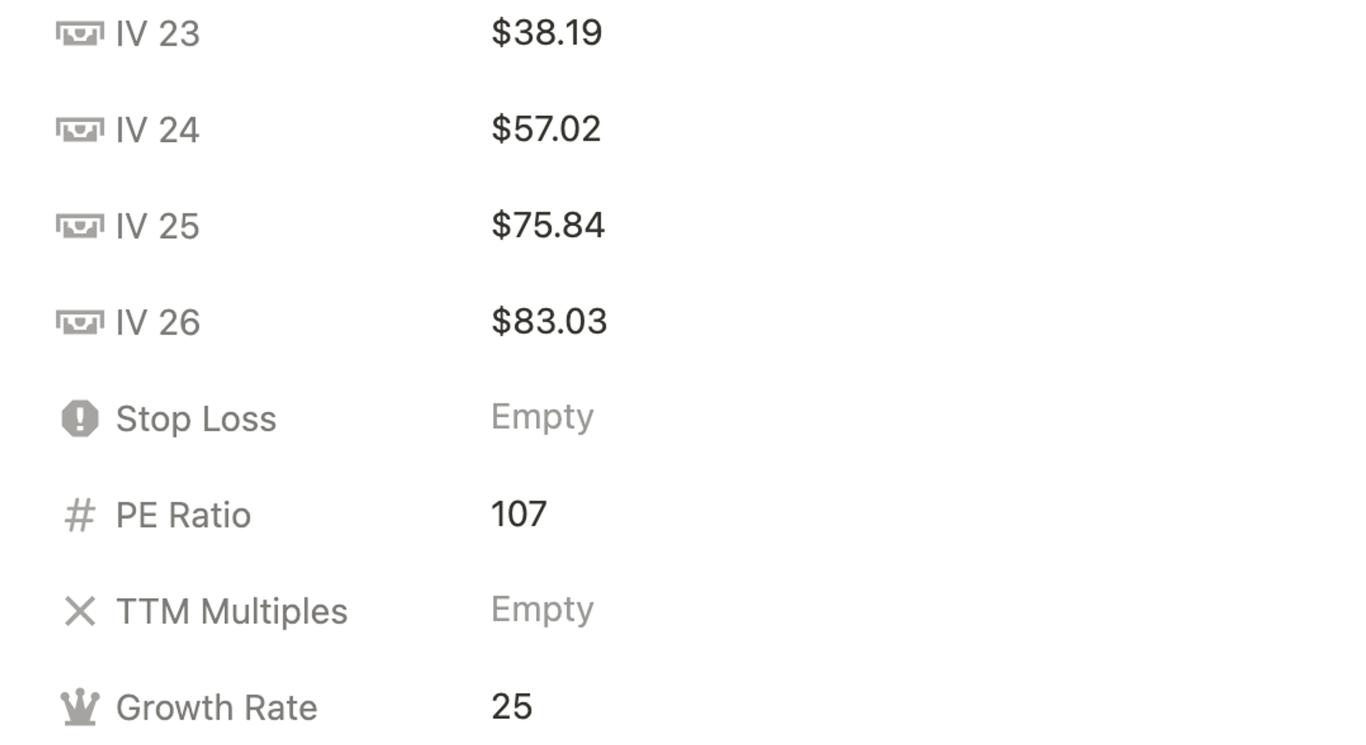
- P/E Ratio: 168x, higher than the industry average, reflecting a growth premium.
- P/S Ratio: 13.7x, indicating that the market values its revenue growth highly.
- Forward P/E: 30.2x, suggesting a continued growth trajectory.
- PEG Ratio: 1.1, highlighting a good balance between growth and valuation.
- Market Cap: $137 billion, solidifying its status as a large-cap stock.
📈 Growth Metrics
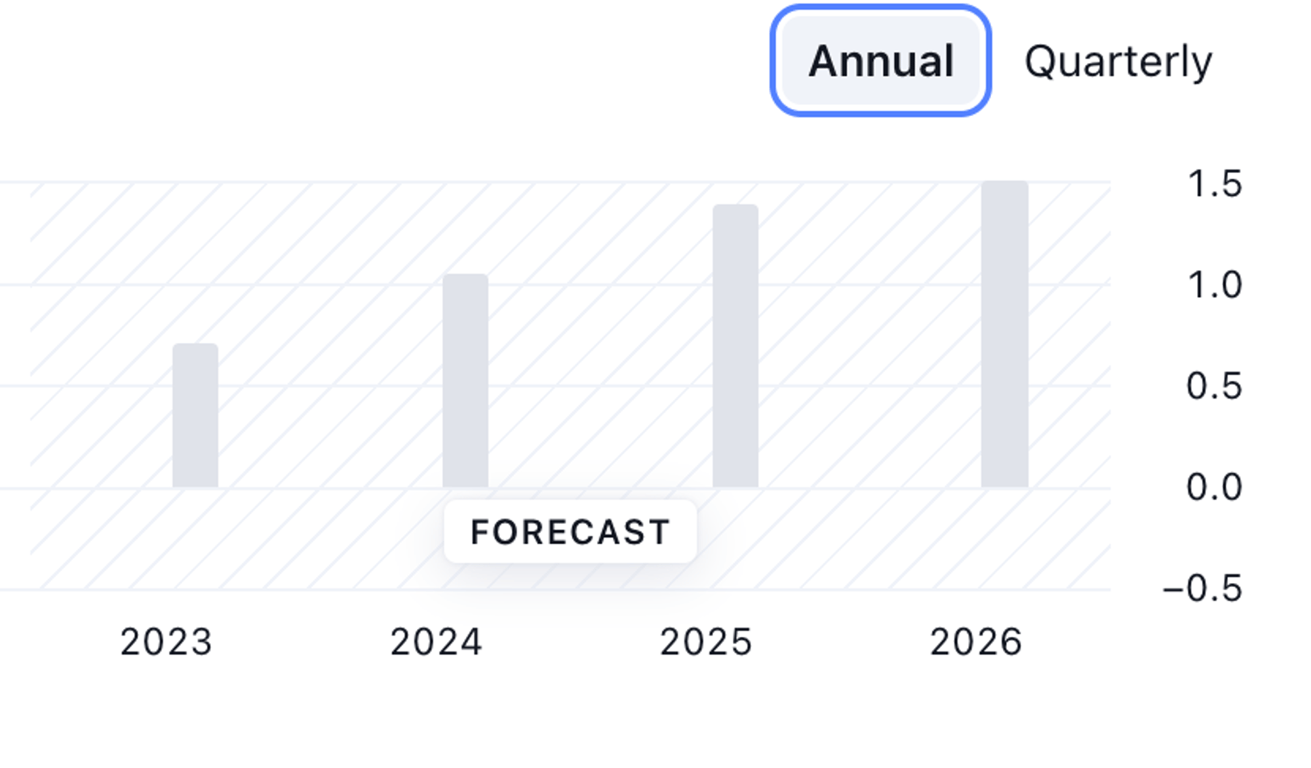
- 2025 EPS Growth Forecast: Shopify is projected to see continued strong growth, driven by e-commerce expansion and merchant solutions.
- Price Target: Analysts have set a consensus price target of $94.87, reflecting confidence in Shopify’s sustained performance.
🔍 Revenue Breakdown
- Merchant Solutions (72%): $1.55 billion (+26% YoY)
- Growth driven by increased adoption of Shopify Payments and other merchant services.
- Subscription Solutions (28%): $605 million (+26% YoY)
- Boosted by higher subscription plan uptake and new merchant additions.
🔮 Forecast
Shopify continues to expand its footprint in the e-commerce sector, with strong financials and market leadership. However, challenges such as high valuations, fierce competition, and slowing growth in subscription revenue temper its long-term appeal. While the stock remains a growth story, the risks warrant a cautious approach.
Final Summary
- 🚀 Buy with Caution: Shopify’s growth potential in e-commerce is compelling, but elevated valuations and competitive risks reduce its overall attractiveness.
- 📊 Strong Financials: Robust revenue growth and consistent profitability highlight Shopify’s operational strength.
- 💡 Valuation Concerns: The high P/E and P/S ratios limit its upside potential in the short term.
- ⚠️ Risks: Competition from Amazon, Wix, and others, coupled with macroeconomic uncertainties, could weigh on future performance.
Shopify is a promising long-term growth stock but earns a B rating due to valuation concerns and competitive risks.
Interesting Facts
🕶️ Chronological Update below 👇🏻
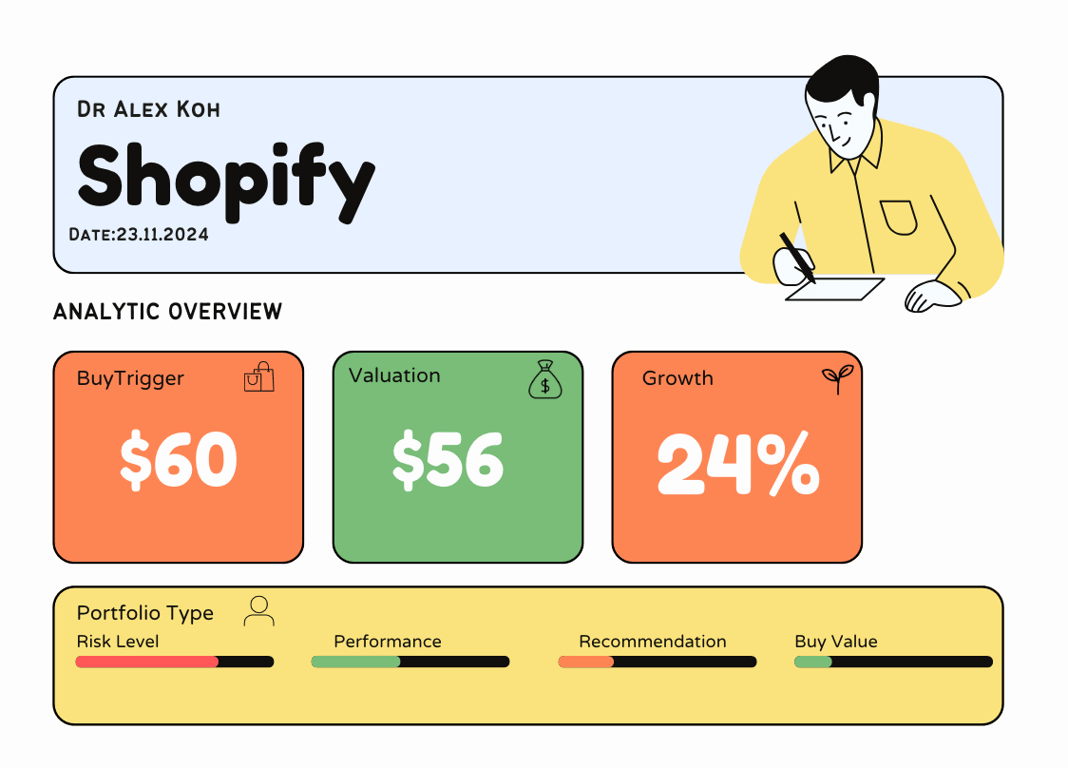
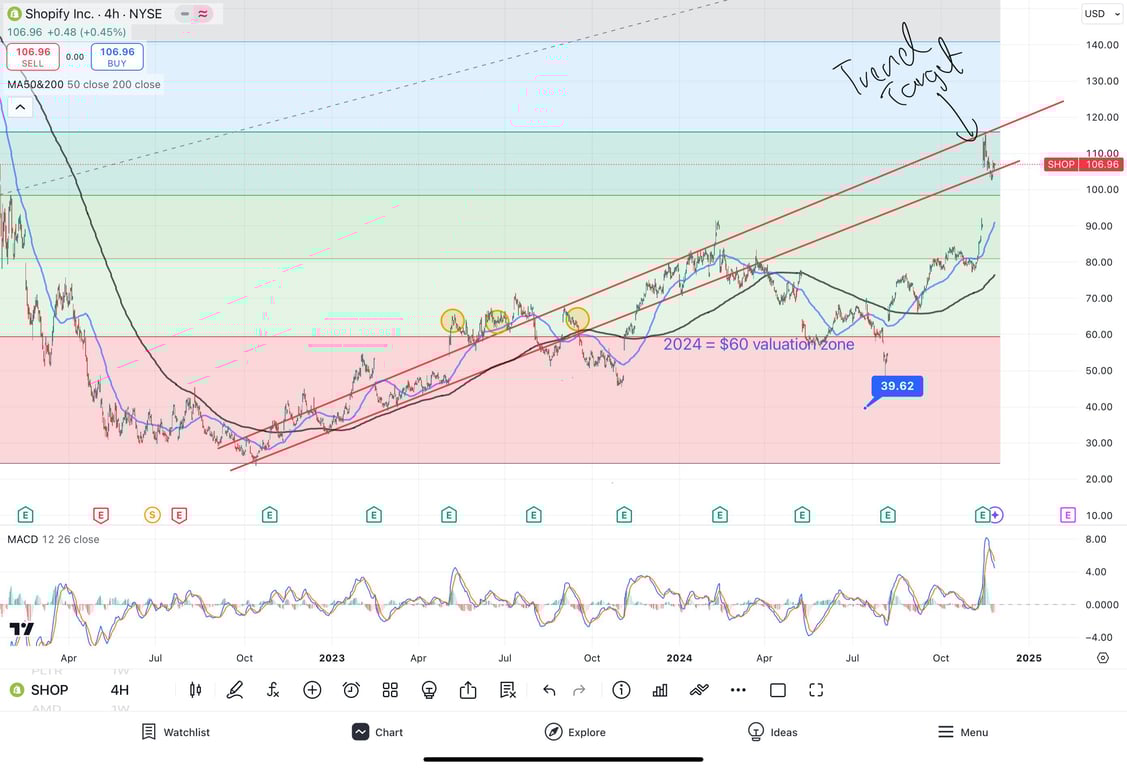
Technical Analysis Update [Nov 23, 2024 09:52 AM GMT+01:00]
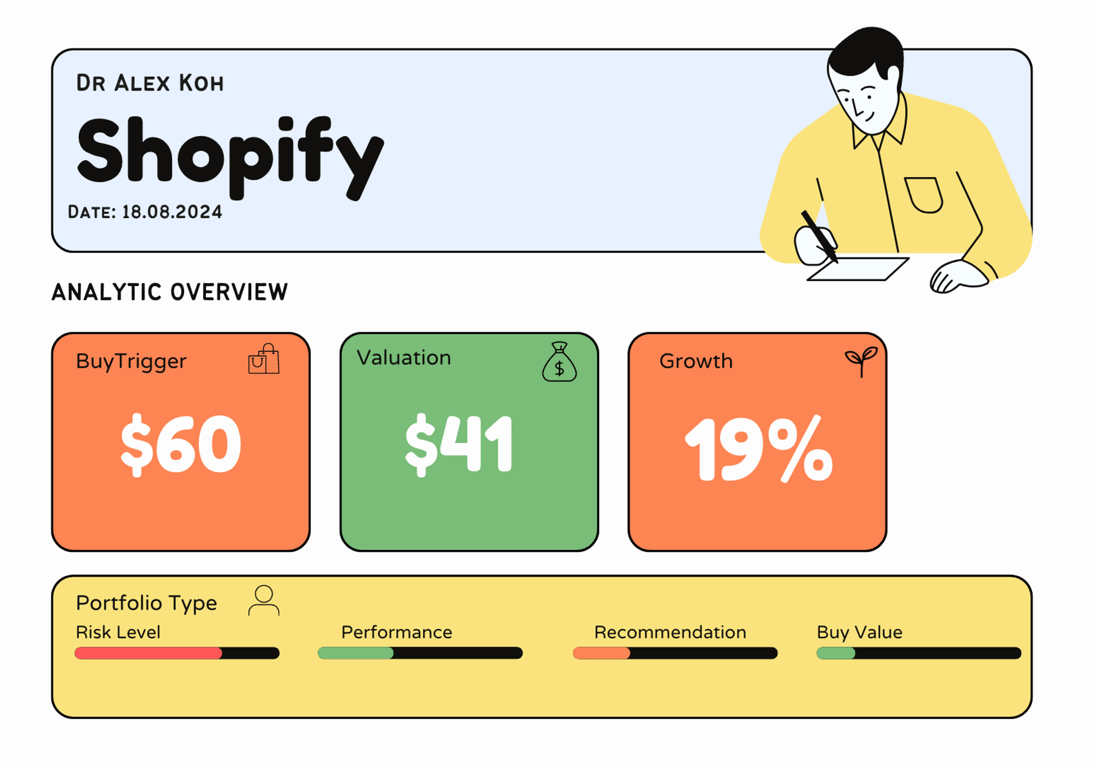
Technical Analysis Update [Aug 18, 2024 08:08 PM GMT+01:00]
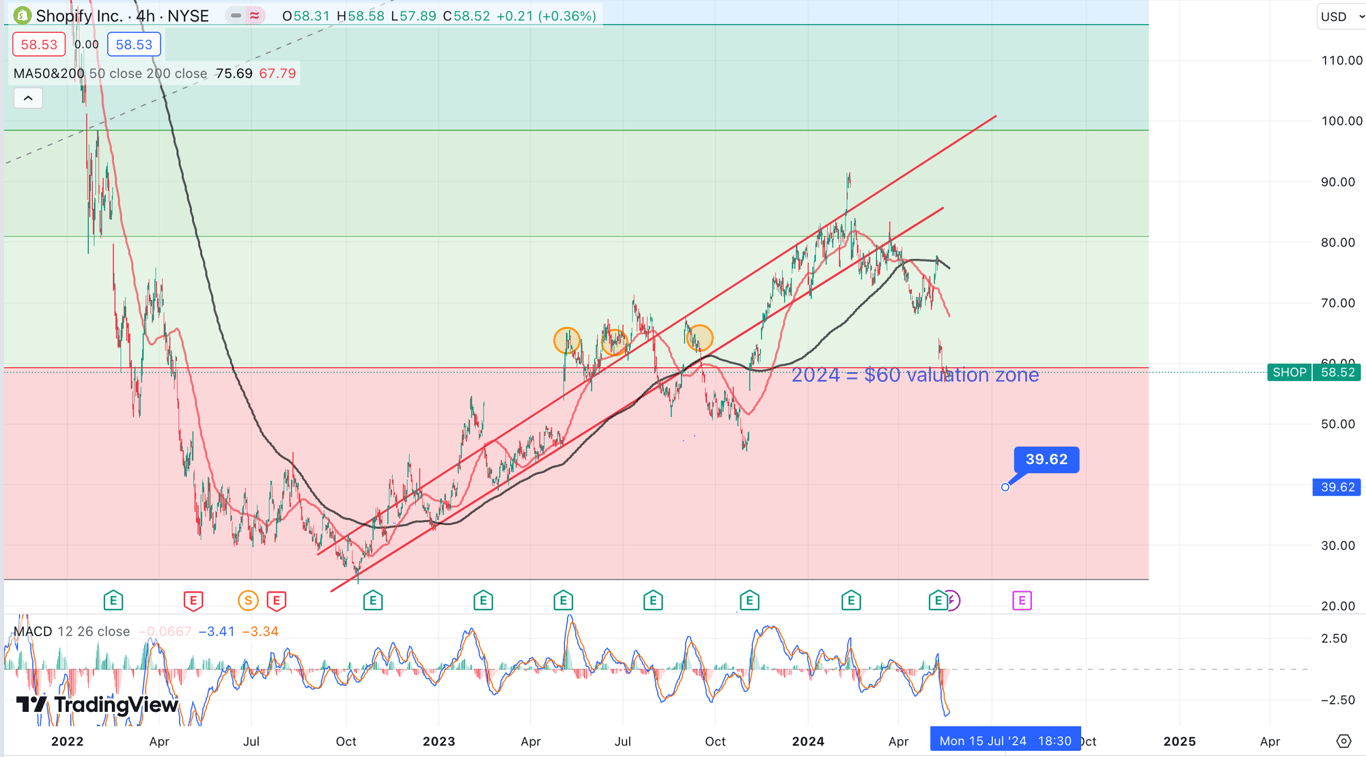
- BuyTrigger $60.
- Bullish Reversal trend looking for a golden cross after being denied back in July.
- The strength for Shopify is innovation and international growth.
- Its an overvalued stock play as always.
Technical Analysis Update [Jul 9, 2024 08:12 AM GMT+01:00]
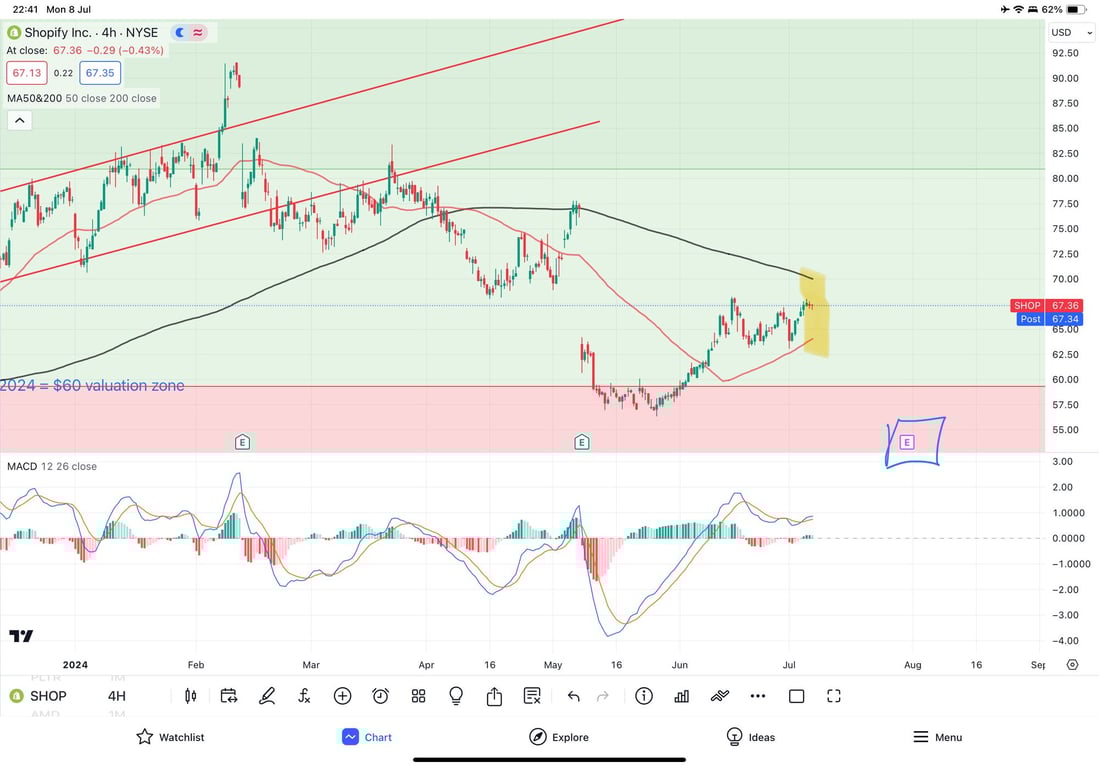
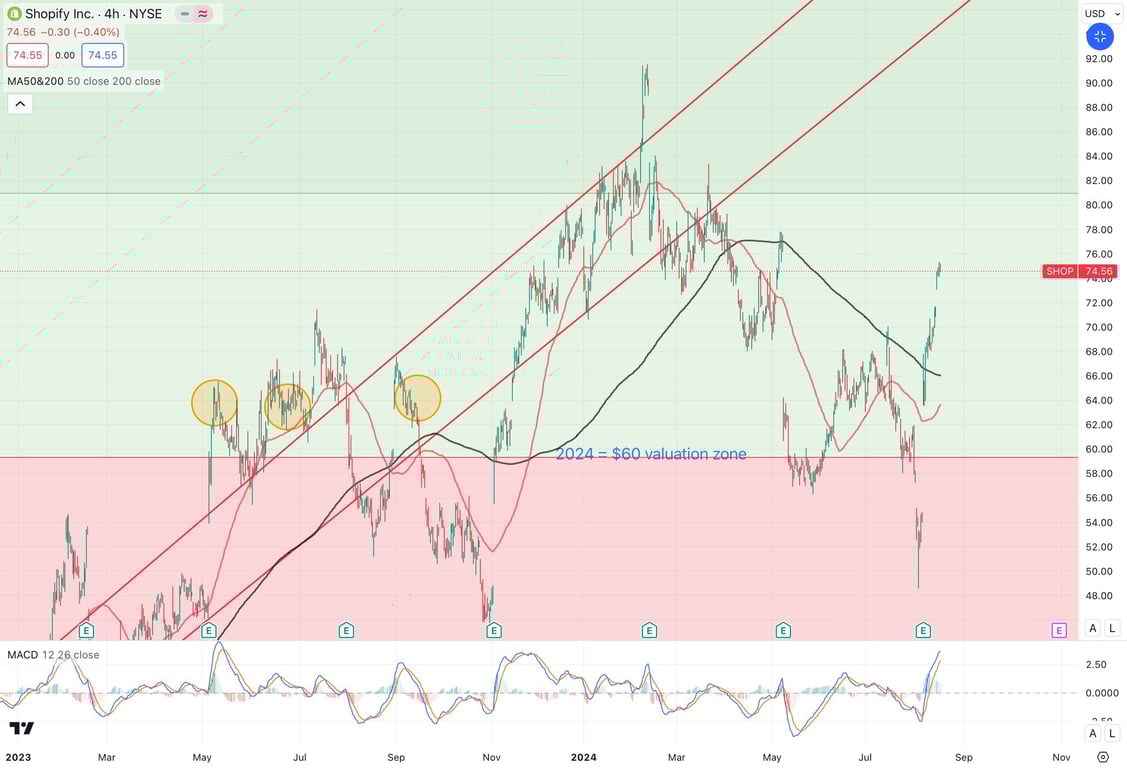
- Support and Resistance: The highlighted yellow zone around $67-$70 appears to be a critical resistance level. This level aligns with the previous highs and the 200-period moving average, indicating strong resistance.
- Moving Averages: The 50-period moving average (red line) is below the current price, offering support, while the 200-period moving average (black line) at approximately $70 serves as resistance. A decisive break above the 200-period MA would be a bullish signal, but failure to do so might lead to a pullback.
- MACD (Moving Average Convergence Divergence): The MACD is currently in bullish territory, but the lines are close, indicating potential indecision. A bearish crossover could signal a downside move, especially if it coincides with failure at the resistance zone.
- Price Channels: The red lines indicate a long-term upward channel, but the price has broken below it. Re-entering this channel would require sustained bullish momentum, which seems challenging given the current resistance.
- Valuation Zone: The $60 valuation zone marked on the chart acts as a support region. If the price fails to break above the resistance, a pullback to this zone is possible.
- Potential Scenarios:
- Bullish Scenario: A breakout above $70 with strong volume could propel the price towards $75-$80. Confirmation would be needed from the MACD and volume indicators.
- Bearish Scenario: Failure to break above the 200-period MA might lead to a decline back towards the $60-$62 support zone, especially if the MACD turns bearish.
In summary, Shopify is at a crucial juncture with significant resistance ahead. Watch for a breakout above the 200-period MA with supportive indicators for a bullish confirmation. Conversely, prepare for a potential pullback to the $60-$62 range if the resistance holds and the MACD signals a bearish crossover.
Technical Analysis Update [Jun 28, 2024 06:05 PM GMT+01:00]
Key Technical Indicators:
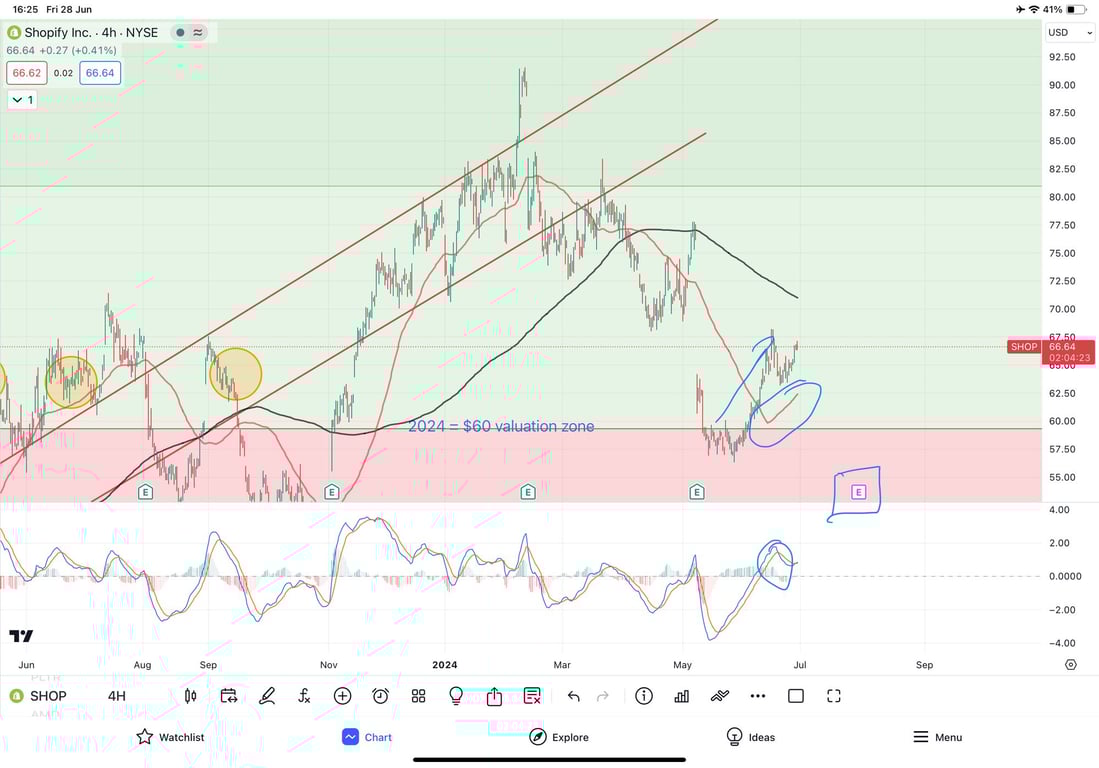
- Price Movement: The stock has moved up from the $60 valuation zone, indicating strong support at this level. The recent upward momentum is highlighted by three consecutive green candles, suggesting institutional buying.
- Moving Averages: The stock has breached the 50-day moving average, a bullish sign. If it can maintain this level for the next 8 weeks, it could form a golden cross, further supporting a bullish trend.
- MACD: The MACD is in negative territory but is showing signs of rising, potentially crossing into positive territory soon. This could indicate a continuation of the current upward momentum.
Technical Analysis Update [May 19, 2024 10:40 PM GMT+01:00]
Price Valuation Update Dec 26, 2023 12:55 AM GMT+01:00
Technical Analysis Update Dec 26, 2023 12:52 AM GMT+01:00
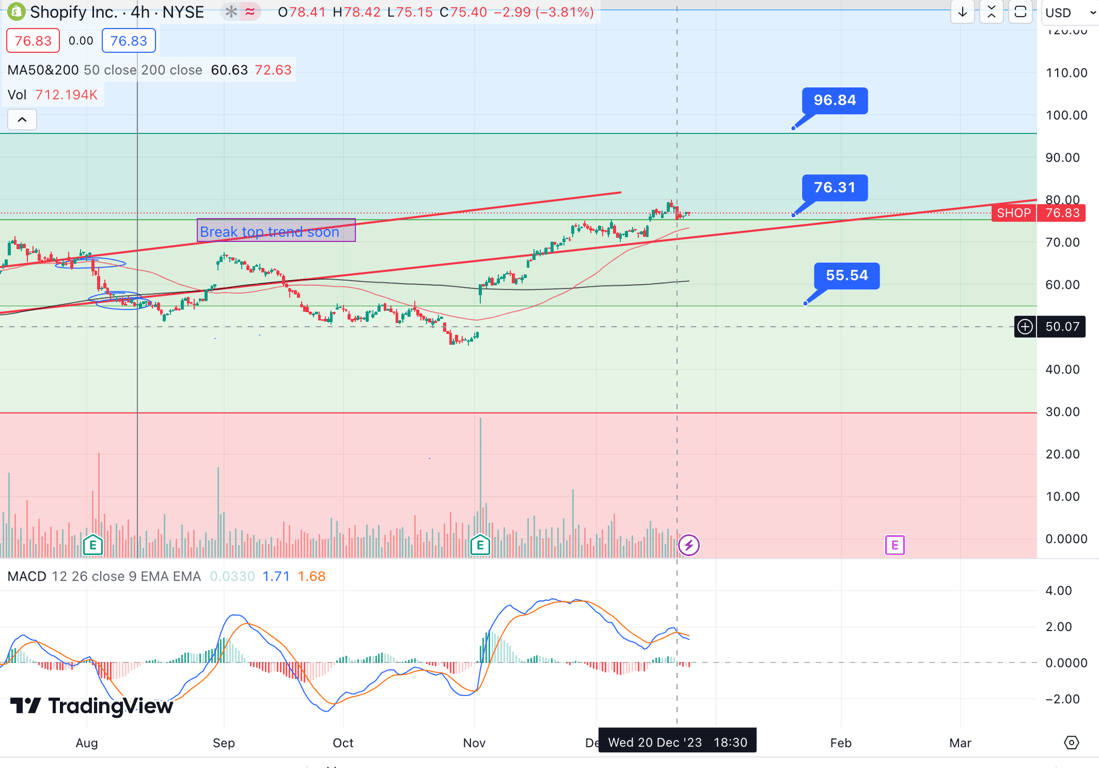
- Way overbought. The extended run from 60-76 is not sustainable. The revenue growth isnt convincing enough to hold it at that level if we want it to keep at PE 100.
- The tech with AI and growth on smaller scale business is great but the macro slow down in shopping could be risky for the sustainable growth.
- Its best to take profit and reduce risk for a lowe $55 level entry.
- We need to see severe revenue boost growth, otherwise no reason for it to grow. Unless some TEMU type disruption comes in place or tiktok media marketting kicks off, I will hold my cash.