

Snowflake Inc. (SNOW) Stock Comprehensive Review as of December 6, 2024 🟠
Current Price: $183.06
Industry: Cloud Computing, Data Warehousing
Stock Type: Growth
Rating: B
Key Financial Metrics (Q3 2024)
- Revenue: $942.1 million, up 28% year-over-year.
- Net Income: $60 million, compared to a net loss of $41 million in Q3 2023.
- Gross Margin: 76%, indicating strong operational efficiency.
- EPS (Earnings Per Share): $0.20, surpassing analyst expectations of $0.15.
- Free Cash Flow: $200 million, reflecting robust cash generation.
💰 Valuation Analysis
- P/E Ratio: 915.3x, significantly higher than the industry average, reflecting a substantial growth premium.
- P/S Ratio: 25.3x, indicating high market valuation of its revenue growth.
- Forward P/E: 150.2x, suggesting a challenging valuation.
- PEG Ratio: 2.5, showing the valuation is not fully aligned with growth prospects.
- Market Cap: $56.7 billion, classifying it as a large-cap stock.
📈 Growth Metrics
- 2025 EPS Forecast: $0.70, indicating robust but moderating growth.
- 2026 EPS Forecast: $0.99, with a growth rate of 41.78%.
- Price Target: Analysts have set a consensus price target of $180.68, reflecting a slight potential downside from the current price.
🔍 Revenue Breakdown
- Product Revenue (90%): $847.9 million (+30% YoY)
- Growth driven by increased customer adoption and expanded use cases.
- Professional Services and Other (10%): $94.2 million (+15% YoY)
- Steady growth in consulting and training services.
🔮 Forecast
Snowflake continues to solidify its position in the cloud data warehousing market, with strong financials and a growing customer base. The company’s focus on AI and machine learning integration adds to its appeal. However, current valuations leave limited room for upside, as the price-to-sales and price-to-earnings multiples remain elevated.
Final Summary
- 🚀 Potential Buy with Caution: Snowflake’s leadership in cloud data warehousing and strong financial performance make it a compelling investment, but only at the right valuation.
- 📊 Financials Strengthening: The shift to profitability and improving free cash flow are positive signs, but valuation remains a concern.
- 💡 Valuation Overhang: Current multiples reflect high expectations, which could lead to downside risk if growth moderates or misses expectations.
- ⚠️ Key Risks: Overvaluation is a significant risk, especially for long-term investors. Competitive pressures and slowing growth could further affect the stock.
Snowflake earns a B rating, emphasizing its growth potential while acknowledging the risks of overvaluation and tempered analyst forecasts. Investors should be cautious not to overpay for a stock trading at premium levels.
Interesting Facts

🕶️ Chronological Update below 👇🏻
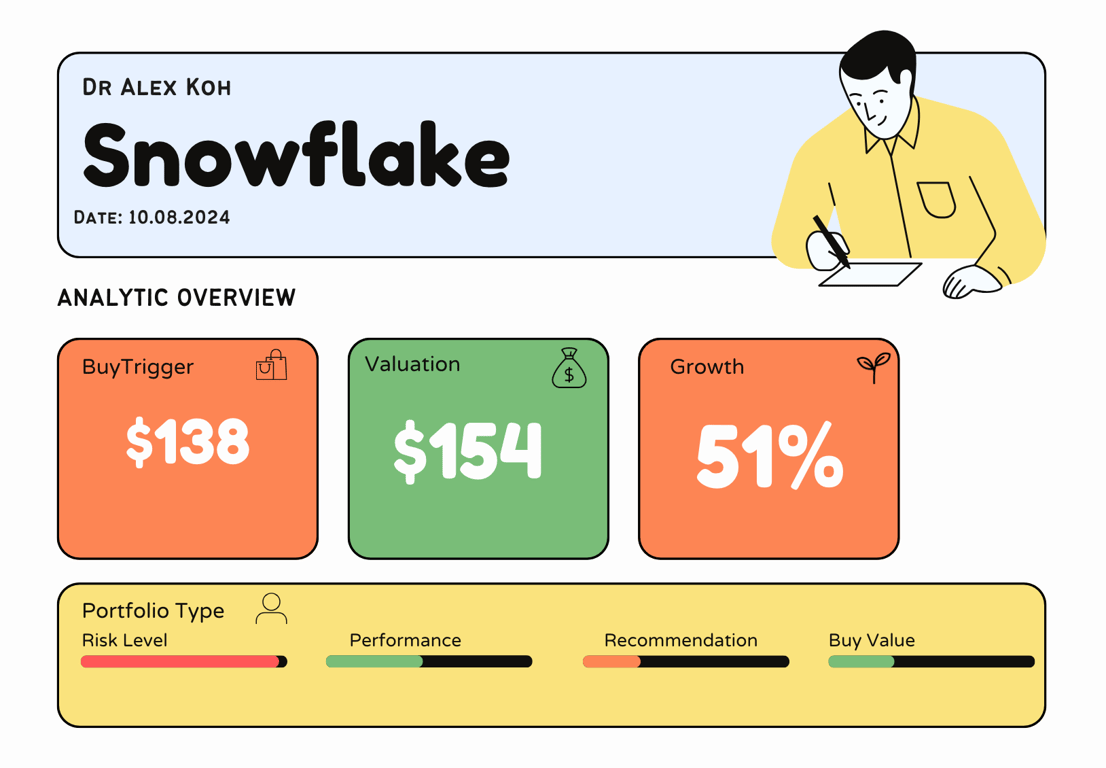
Technical Analysis Update [Aug 18, 2024 02:02 PM GMT+01:00]
- Earnings coming up. If they still not exceeding the AI expectation I am expecting a breakdown.
- Too risky to even try to gamble here as a 20% drop is possible.
- I would consider if they start breaking upwards or else money is better vested elsewhere for now.
Price Valuation Update[Aug 11, 2024 12:02 AM GMT+01:00]
Reason for Update
- New formula for new int rate hike september.
- Valuation have dropped slightly but growth increase by 2% with 2028 forecast.
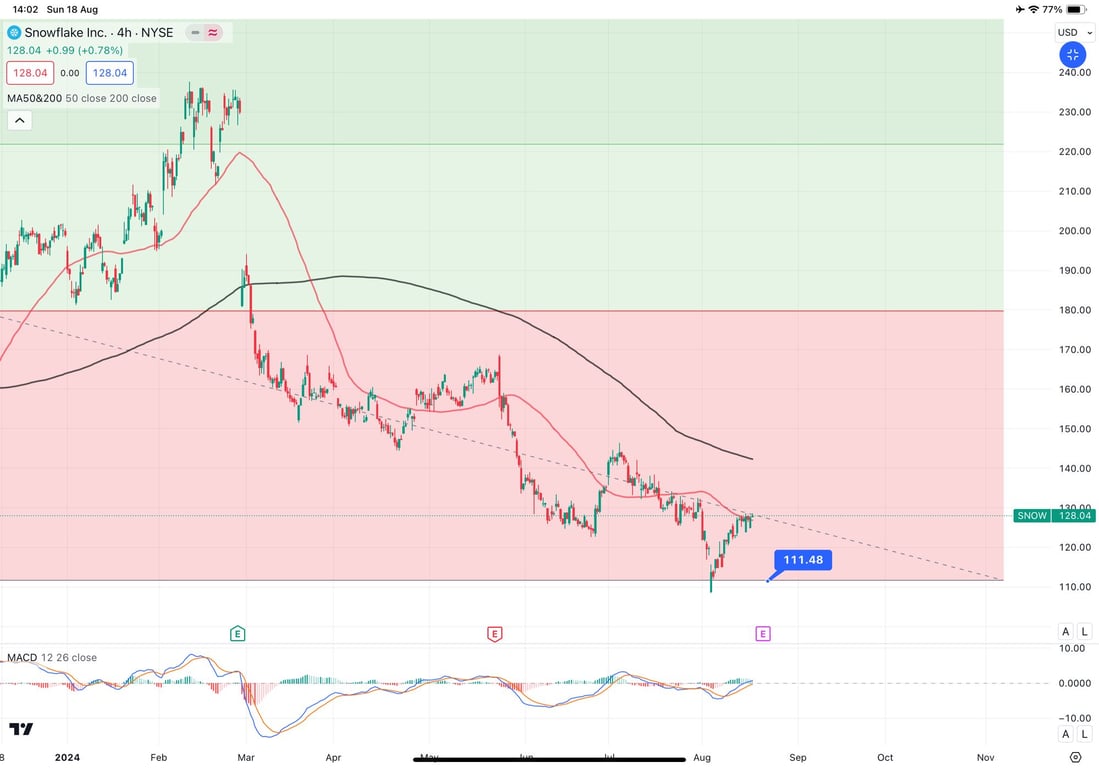
Technical Analysis Update [Jul 10, 2024 12:08 AM GMT+01:00]
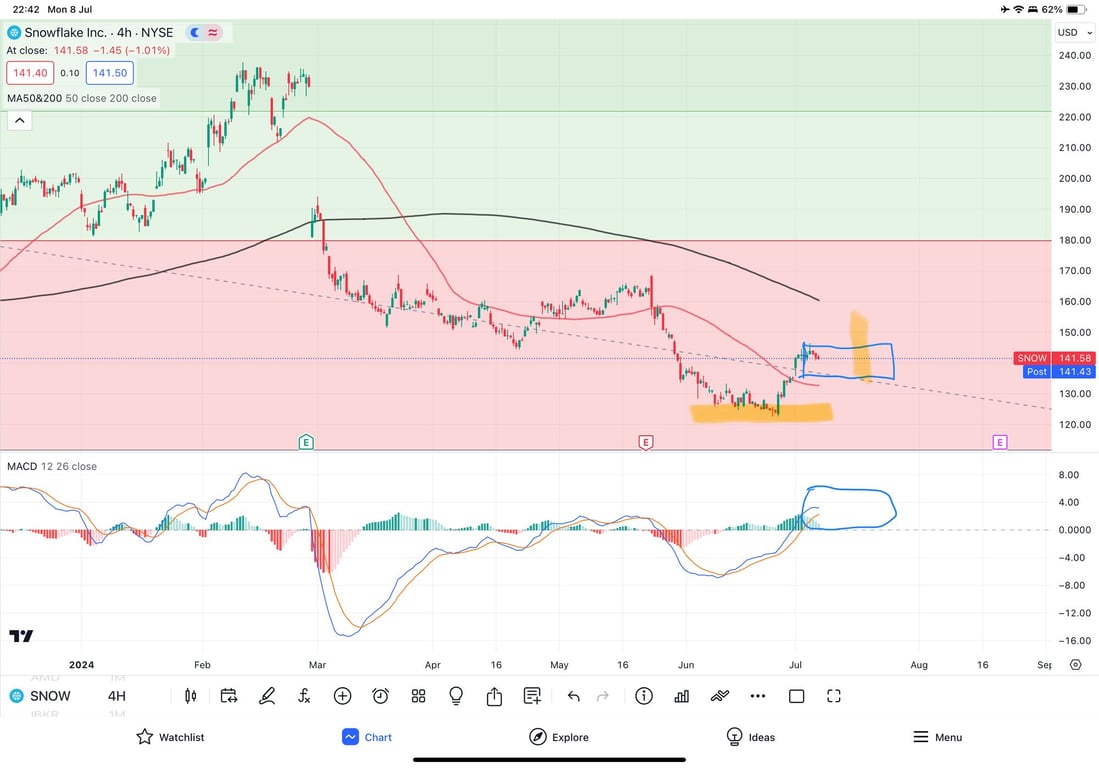
- Support and Resistance:
- Support: The orange highlighted area around $130 has acted as a strong support zone recently, showing a significant bounce from that level.
- Resistance: The current resistance appears to be in the $150-$155 range, which includes the 50-period moving average (red line).
- Moving Averages:
- The 50-period moving average (red line) is acting as resistance and is crucial for the next move. A break above this level could indicate a bullish trend reversal.
- The 200-period moving average (black line) is above at around $165, serving as a more significant resistance level if the price continues to move up.
- MACD (Moving Average Convergence Divergence):
- The MACD has recently crossed into bullish territory and is currently rising, indicating positive momentum. The histogram is also green, which is a positive sign.
- However, the MACD lines are starting to converge, suggesting potential weakening momentum. Watch for a potential bearish crossover which could signal a pullback.
- Price Action:
- The price action shows a clear recovery from the $130 support zone and is now testing the resistance around $150. This range is crucial for determining the next direction.
- The marked blue box indicates a potential consolidation area between $135 and $150, where the price might move sideways before breaking out.
- Trend Line:
- The dotted trend line shows a downward trend that the price is currently challenging. A decisive break above this trend line would be a bullish signal.
- Potential Scenarios:
- Bullish Scenario: If the price breaks above the $150-$155 resistance with strong volume, it could target the 200-period MA around $165, and potentially higher towards $180.
- Bearish Scenario: Failure to break above the current resistance could lead to a retest of the $130 support zone. A break below this support would signal further downside, potentially towards $120 or lower.
- Volume and Earnings:
- Keep an eye on the volume during this consolidation phase. Higher volume on a breakout or breakdown will confirm the direction.
- Upcoming earnings (marked with "E") could also be a significant catalyst for price movement. Be cautious around this period as volatility tends to increase.
In conclusion, Snowflake Inc. is at a critical juncture with key levels at $130 (support) and $150-$155 (resistance). The MACD suggests positive momentum, but the convergence of lines warrants caution. Monitor for a breakout or breakdown with volume confirmation, and be aware of the potential impact of upcoming earnings.
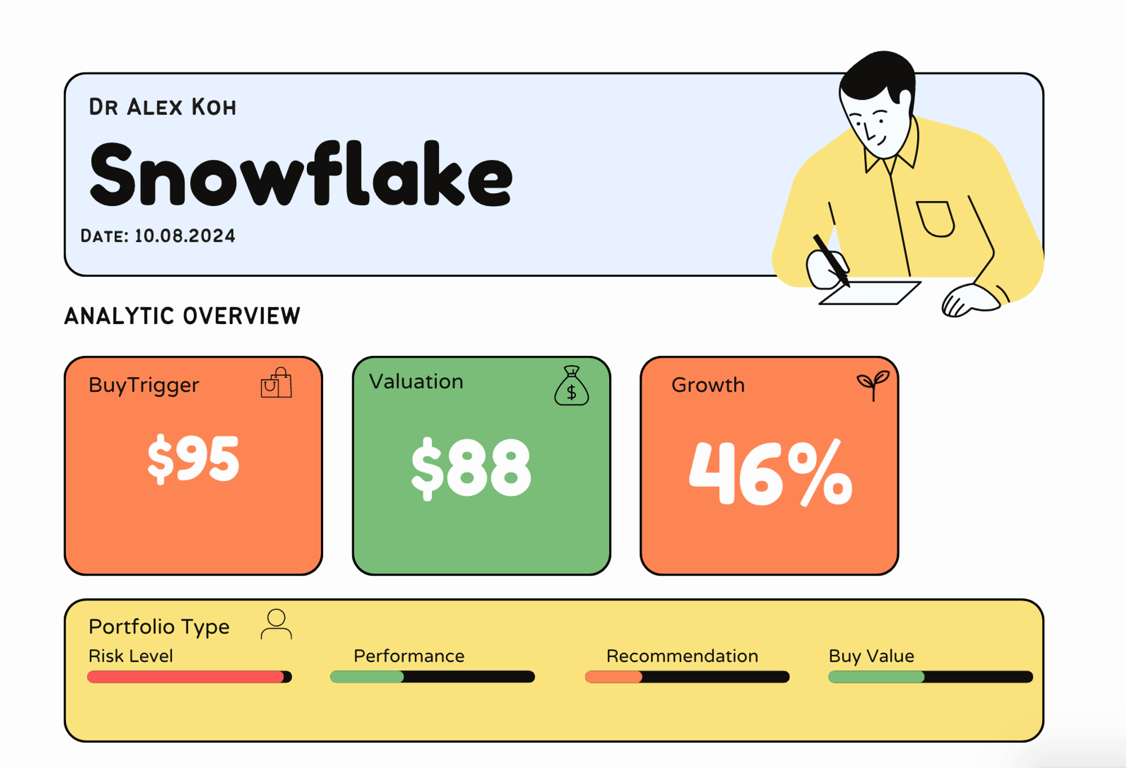
Technical Analysis Update [Jun 28, 2024 06:03 PM GMT+01:00]
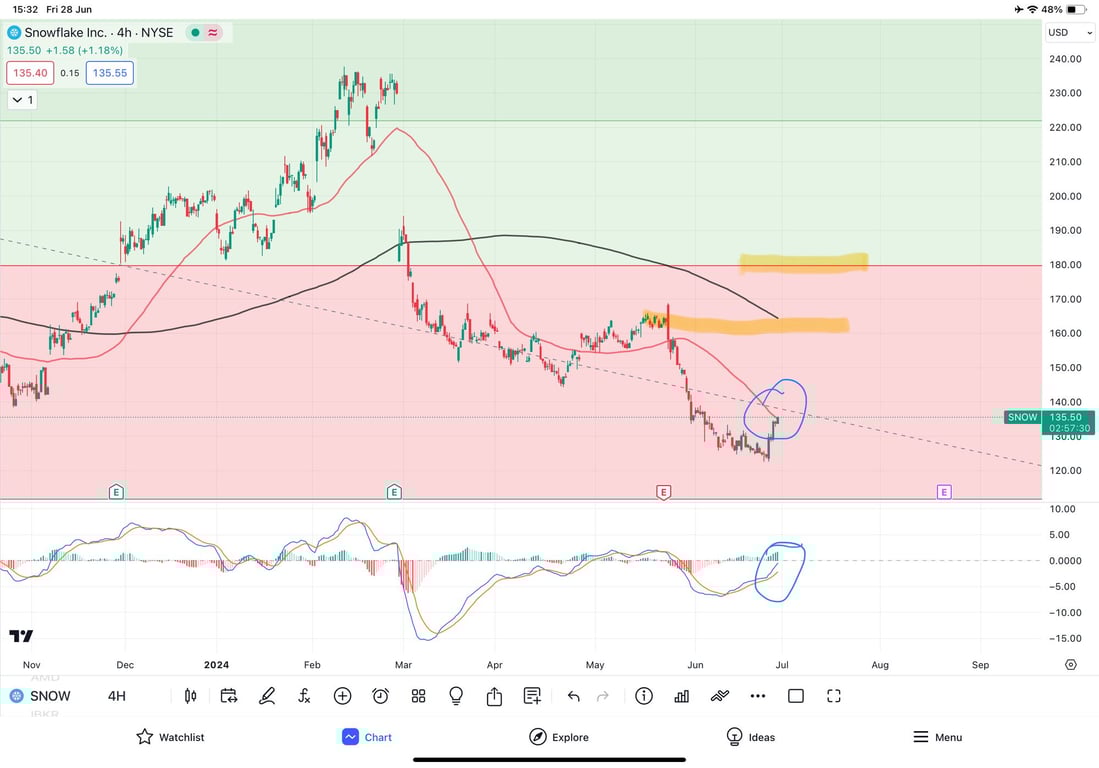
- Snowflake appears overvalued to me. Regardless of the numbers or future forecasts, I am sticking to a $91 valuation. The only reason it appears here is because the technical analysis indicates a potential bounce. The last three green candle spikes suggest that institutions are buying in.
- Another observation is that the MACD is negative but possibly rising to the positive side. Lastly, the 50-day moving average (MA) is being breached, causing a reversal. If it stays above the 50-day MA for the next 8 weeks, we could see the formation of a golden cross.
Technical Analysis Update [Jun 2, 2024 09:43 AM GMT+01:00]
- deathcross and too high valuation - i think SNOW will go lower than its last low of 111. I would sell and come back later because the 47% growth is still there but on a high interest rate climate valuation is seen differently