
Block Inc. (SQ) Stock Comprehensive Review as of August 2024 🟠
Current Price: $65.87
Industry: Fintech, Digital Payments
Stock Type: Growth, Speculative
Rating: B-
Key Financial Metrics (Latest Earnings)
- Revenue Growth: Block reported a 11.2% YoY increase in revenue for Q2 2024, totaling $6.16 billion, slightly below analyst expectations.
- Net Income: The company posted an EPS of $0.93, which exceeded estimates by $0.09, indicating improved operational efficiency.
- Free Cash Flow: Not specifically detailed, but with net income margins at 3.47%, profitability remains tight, and the company is still navigating high operational costs.
💰 Valuation Analysis
- P/E Ratio: Trailing P/E is 85.55x, reflecting high investor expectations for future growth.
- Forward P/E: 38.30x, indicating that while the stock is expensive, it's expected to grow into its valuation.
- Market Cap: Approximately $40.55 billion, positioning Block as a major player in the fintech space but facing increased competition.
📈 Growth Metrics
- 2024 EPS Growth Forecast: Earnings are expected to grow by 57.56% over the next year, driven by increased usage of Cash App and improvements in Square's ecosystem.
- Price Target: The average price target is $86.20, with a potential 30.86% upside. However, analysts' views are mixed, with the lowest target at $46, indicating substantial risk.
🔮 Forecast
Block has demonstrated steady revenue growth and profitability improvements, but it faces significant challenges, including legal scrutiny and competition. The company's valuation remains high, which might limit short-term upside unless it continues to outperform expectations.
Final Summary
- 📉 Hold with Caution: Block shows potential for growth, but the stock's high valuation and ongoing legal issues present risks.
- ⚠️ Risk Assessment: Legal investigations and competitive pressures could weigh on future performance, despite recent earnings beats.
- 🔎 Mixed Analyst Sentiment: While many analysts recommend a "Moderate Buy," the range of price targets suggests uncertainty about the company's ability to navigate current challenges.
Block remains a speculative investment, with potential upside tied to its ability to expand its digital payment ecosystem while managing legal and competitive risks.
Interesting Facts
🕶️ Chronological Update below 👇🏻
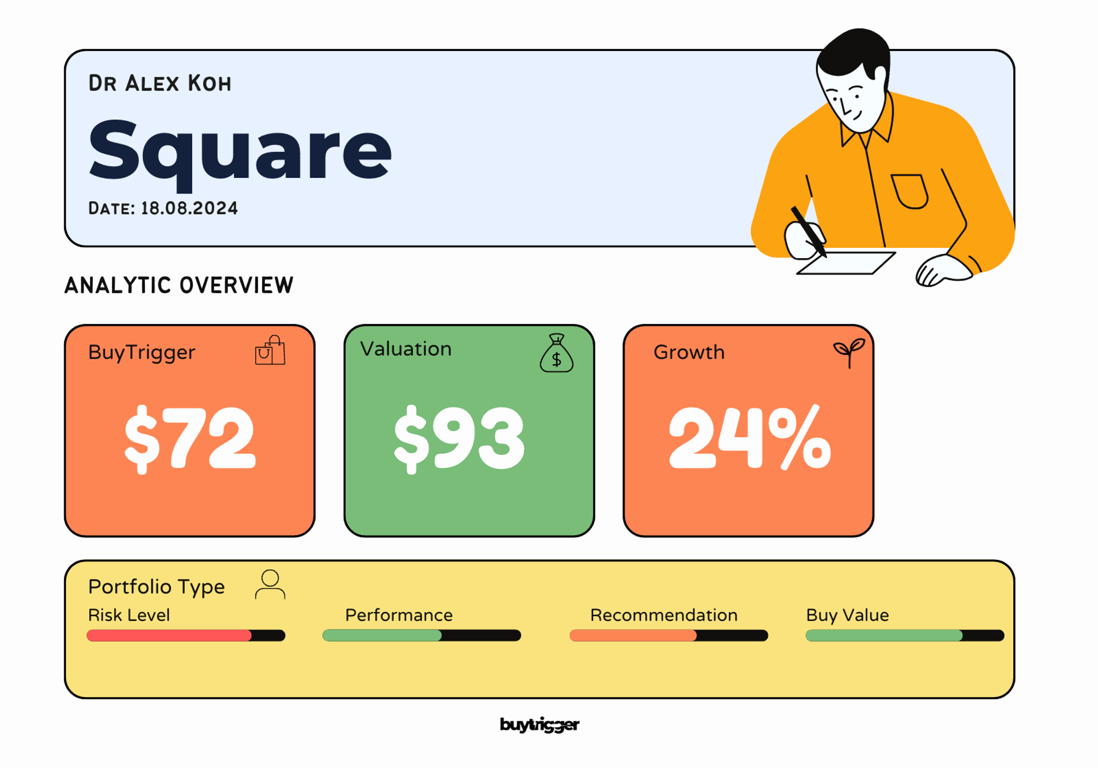
Technical Analysis Update [Aug 18, 2024 02:52 PM GMT+01:00]
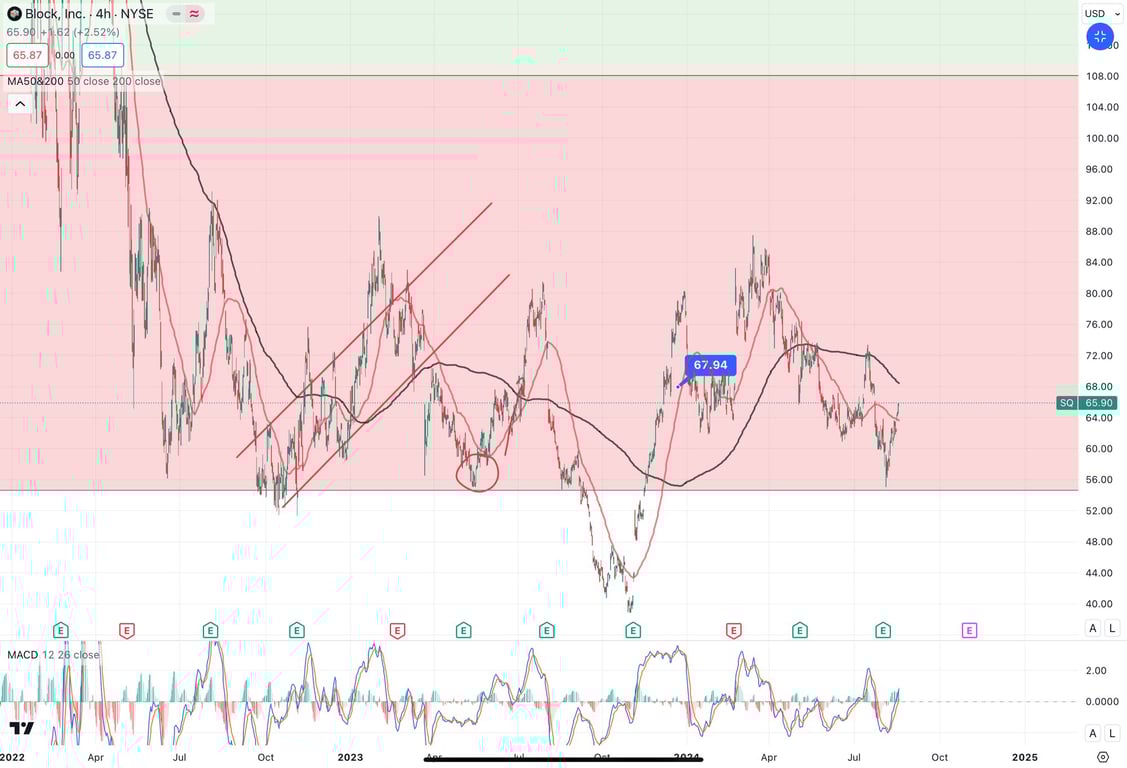
- The valuation dropped from $112 to $93. Still undervalued but unloved at the same time.
- The stock became so reliant on crypto and its basic business being ignored.
- Be patience for the rebound for this one. High Risk and dont exceed 10% in your portfolio ok!
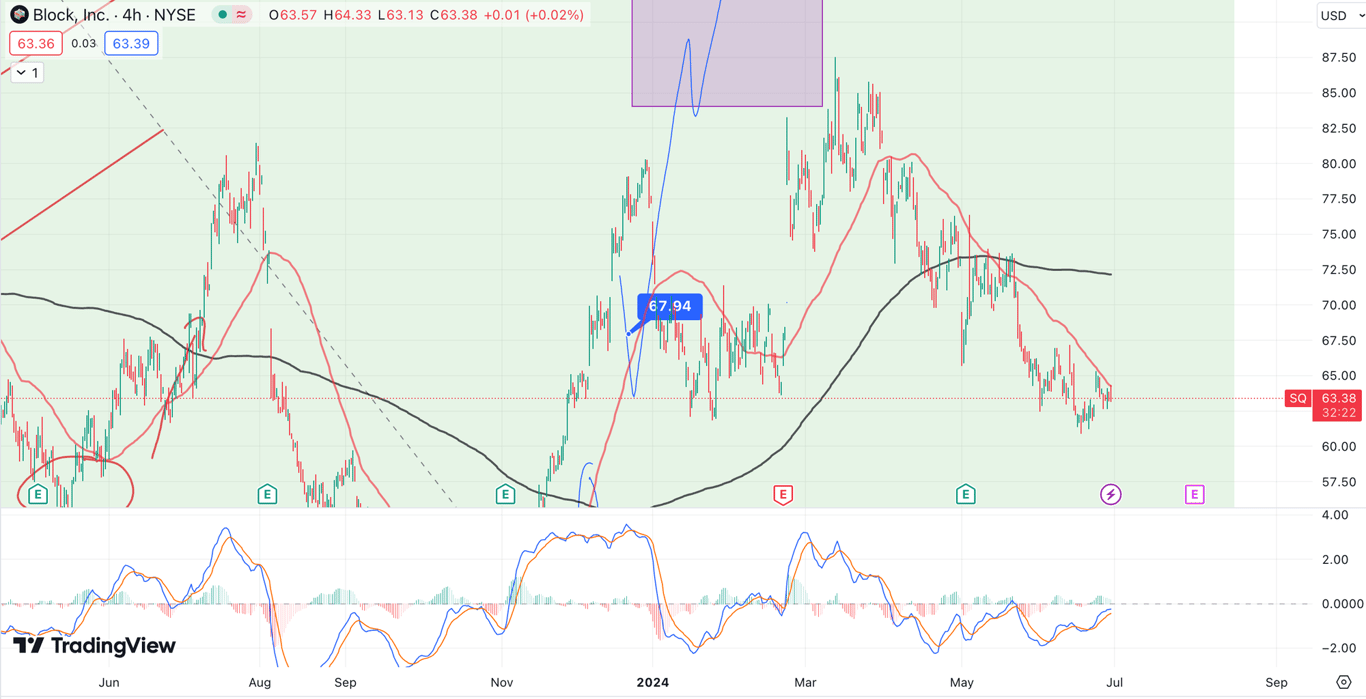
Technical Analysis Update [Jul 10, 2024 12:05 AM GMT+01:00]
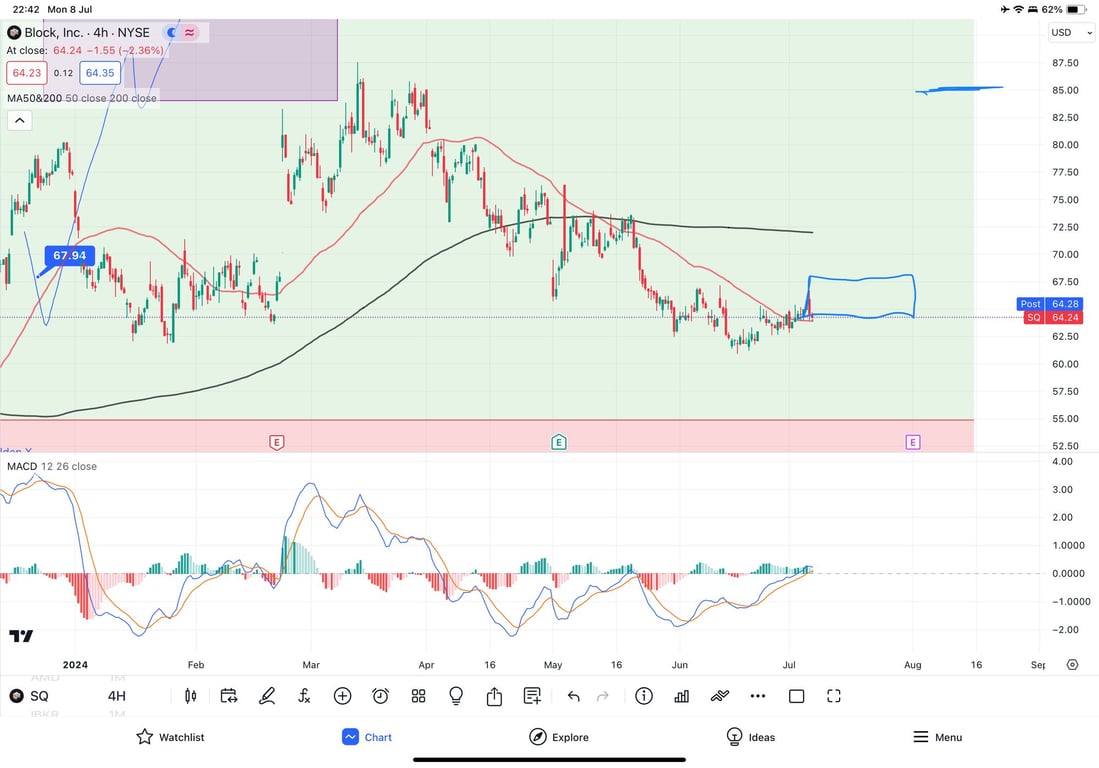
- Support and Resistance:
- The price is currently hovering around $64, which seems to be an important level of interest. This could act as a pivot point, with support just below at around $62 and resistance above at the 200-period moving average near $72.
- Moving Averages:
- The 50-period moving average (red line) is relatively flat and close to the current price, indicating potential short-term support.
- The 200-period moving average (black line) around $72 represents a significant resistance level. A break above this would signal a major bullish move, while failure to break could indicate continued sideways or downward action.
- MACD (Moving Average Convergence Divergence):
- The MACD shows a recent bullish crossover, suggesting potential upward momentum. However, the histogram's small size indicates that the momentum isn't strong yet, and the MACD lines are relatively flat, hinting at possible consolidation.
- Price Action:
- The stock seems to be in a consolidation phase, trading within a range marked by your blue box. This consolidation phase is crucial for determining the next direction. A breakout above $67-$68 could propel the price towards the $72 resistance, whereas a breakdown below $62 might lead to a retest of lower support levels, possibly around $55.
- Potential Scenarios:
- Bullish Scenario: If the price breaks above the $67-$68 level with strong volume, it could head towards the 200-period moving average around $72. Further bullish momentum could target $80 and beyond.
- Bearish Scenario: A failure to break above the current resistance could see the price drop back to test the $62 support. If this level fails, the next significant support is around $55.
- Key Indicators:
- Watch for increased volume on any breakout or breakdown. The MACD's behavior over the next few sessions will also be critical in confirming the direction.
In summary, Block, Inc. is in a consolidation phase with critical levels at $62 and $67-$68. A breakout or breakdown from this range will likely dictate the next significant move. Given the current setup, stay vigilant for volume spikes and MACD signals to confirm the direction.
Technical Analysis Update [Jun 28, 2024 05:54 PM GMT+01:00]
- Potential early bottom trend coming in. Allow time to settle. but monitoring